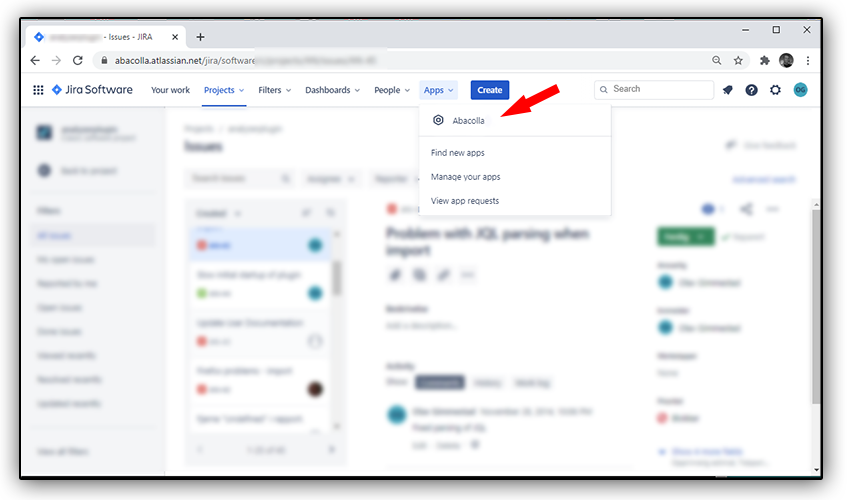
Starting the plugin
You start the plugin by selecting abacolla from the apps menu in Jira
Transfer issues to get started
When the plugin starts you will be presented with the issue transfer screen. Before the analytics engine can start, issues from your projects have to be transfered into the memory of the analytics engine.
Smaller Jira instance
Press the blue start button if you have a smaller Jira instance you may import all issues from Jira to give it to the analyics session. The import may take a while so just have a cup of coffe during the transfer.
Larger Jira instance
If you have many project in your Jira instance and many issues you may want to limit the number of issues to be transferred. You can do this by writing a filter in JQL or selecting the project from the dropdown list under the JQL text field.Example:
project = "MYPROJECT"
Here is a link to the JQL reference
Press the blue start button when you are ready.

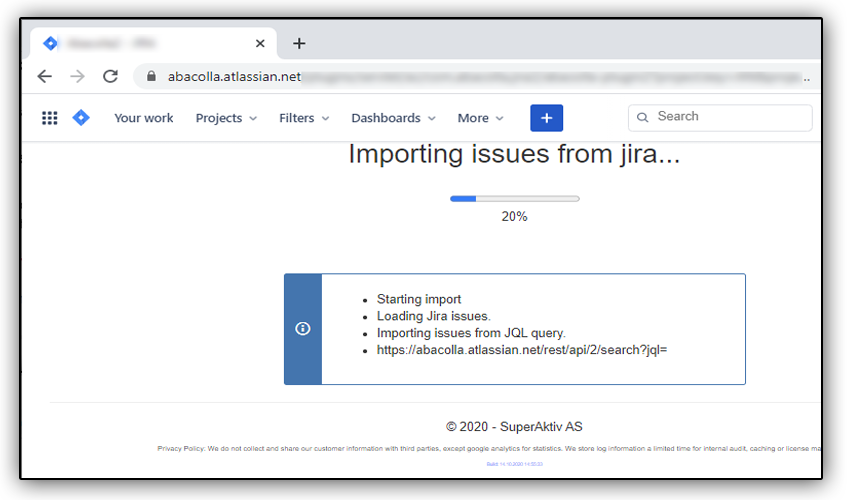
Transferring data
Relax during the import and follow the progress bar
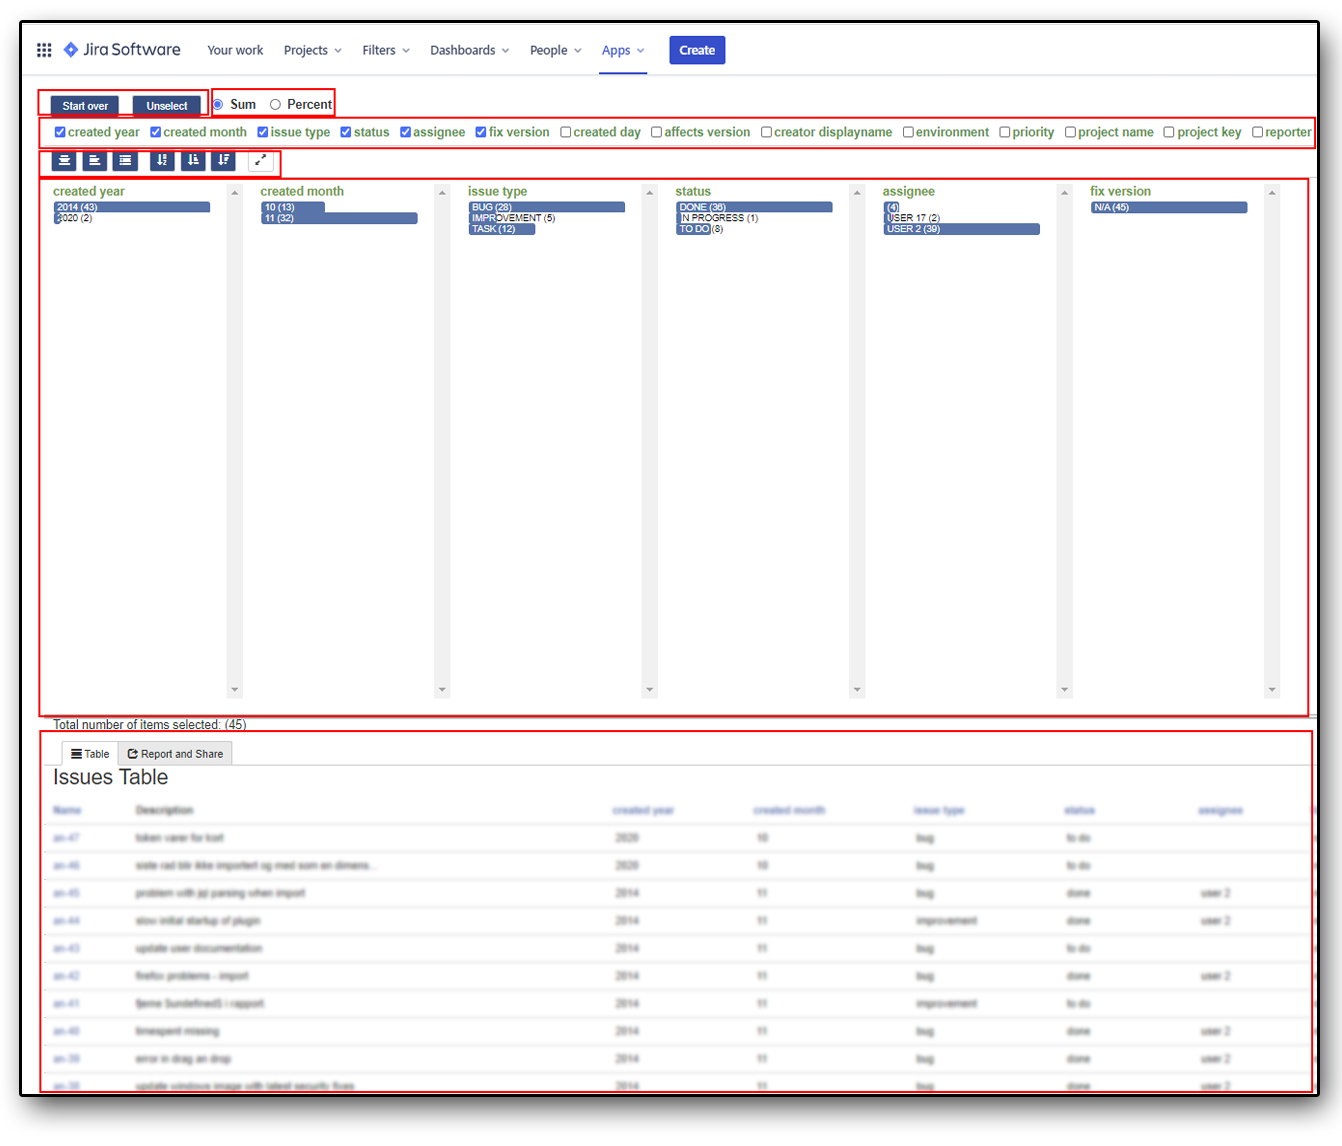
Analysis screen
When all the issues are loaded the analysis screen will appear.
The analysis sceen can be divided into six regions. These regions are illustrated by the red frames in the image below.
- Restart buttons
- Value display (Sum or percent)
- Variables to display (dimensions)
- Toolbar buttons
- Interactive drilldown area
- Result area
Restart buttons
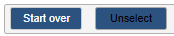
There are two restart buttons.
- Start over
- Unselect
Start over
The start over button will clear all selected dimensions displayed and selected values in these dimensions. It means you can start a search over again.
Unselect button
Dimensions selected will not be reset, but selected values wil be cleared.
Values displayed

There are two value display buttons.
- Sum
- Percent
Sum
Will display the sum of the values within one dimension based on the search selection
Percentage
Will display the percentage of the values within one dimension based on the search selection
Variables to display (dimensions)

You can select dimensions to be used during the data analysis by clicking on the check boxes next to the variable name.
The drilldown order during the analysis is depending on the sequence you select or unselect variables here, but it can be rearranged during the search.
When a box is checked the values of the selected dimension will appear below in the interactive drilldown area. By unchecking a variable it will disappear from the interacive area not be used in the search.
Toolbar buttons

There are seven toolbar buttons affecting the interactive drilldown area from left to right.
- Show mixed display
- Show only bars
- Show only table
- Sort based on alphabet
- Sort ascending
- Sort decending
- Toggle full screen
Select variables fpr the interactive drilldown area
You can select dimensions to be used during the data analysis by clicking on the check boxes next to the variable name.
The drilldown order during the analysis is depending on the sequence you select or unselect variables here, but it can be rearranged during the search.
When a box is checked the values of the selected dimension will appear below in the interactive drilldown area. By unchecking a variable it will disappear from the interacive area not be used in the search.
Interactive drilldown area
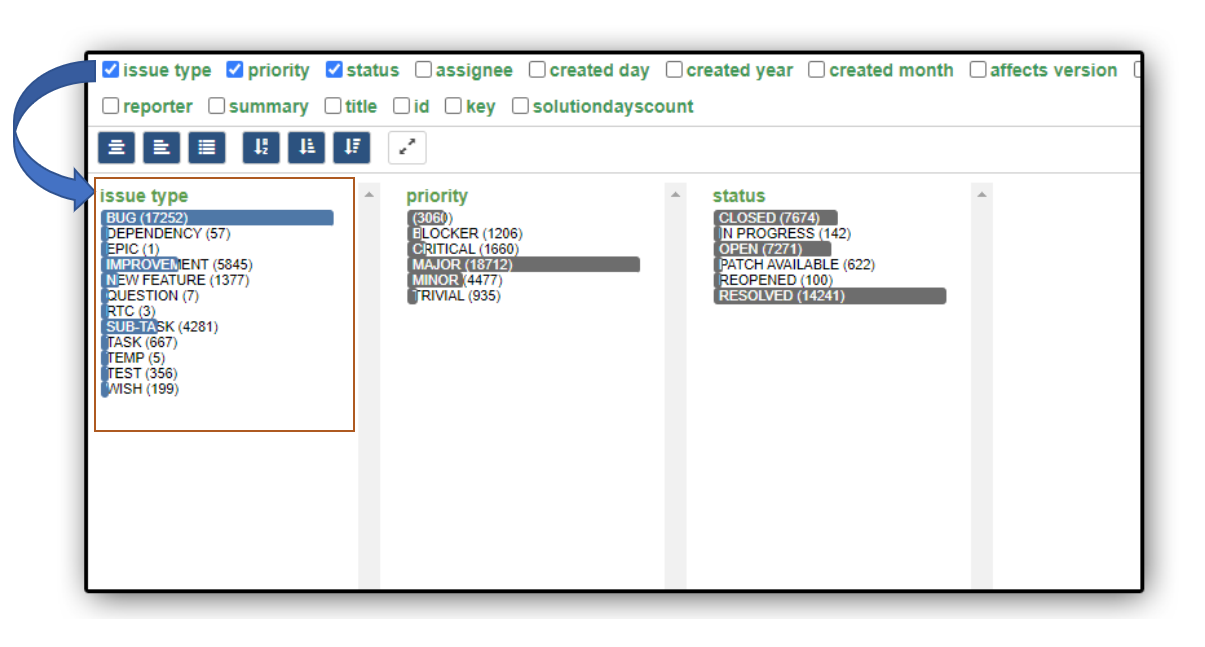
When the a variable is selected its values will be displayed in the interactive drilldown area.
The blue and gray bars show relative size based on the number of issues with the given property of the selcted variable.
If you click on a blue bar you select all the issues with this property. You can click on muliple bars for one variable to add issues to your selection. To undo the selection click once more on the selected bar.
If you have selected multiple variables you will see that the number of values available in the other variables will change.
You can drill down from left to right. You are not allowed to click on gray bars before you have chosen one of the blue bars in the variable left of the variable you want to choose from. If you want to skip one variable, just uncheck it. You can also rearrange the variables by using drag and drop by dragging the title fiels of the column and drop it on the title field of the column you want to move it to. You may also clear all selections and start again. After a drag and drop operation you should clear the selected values.
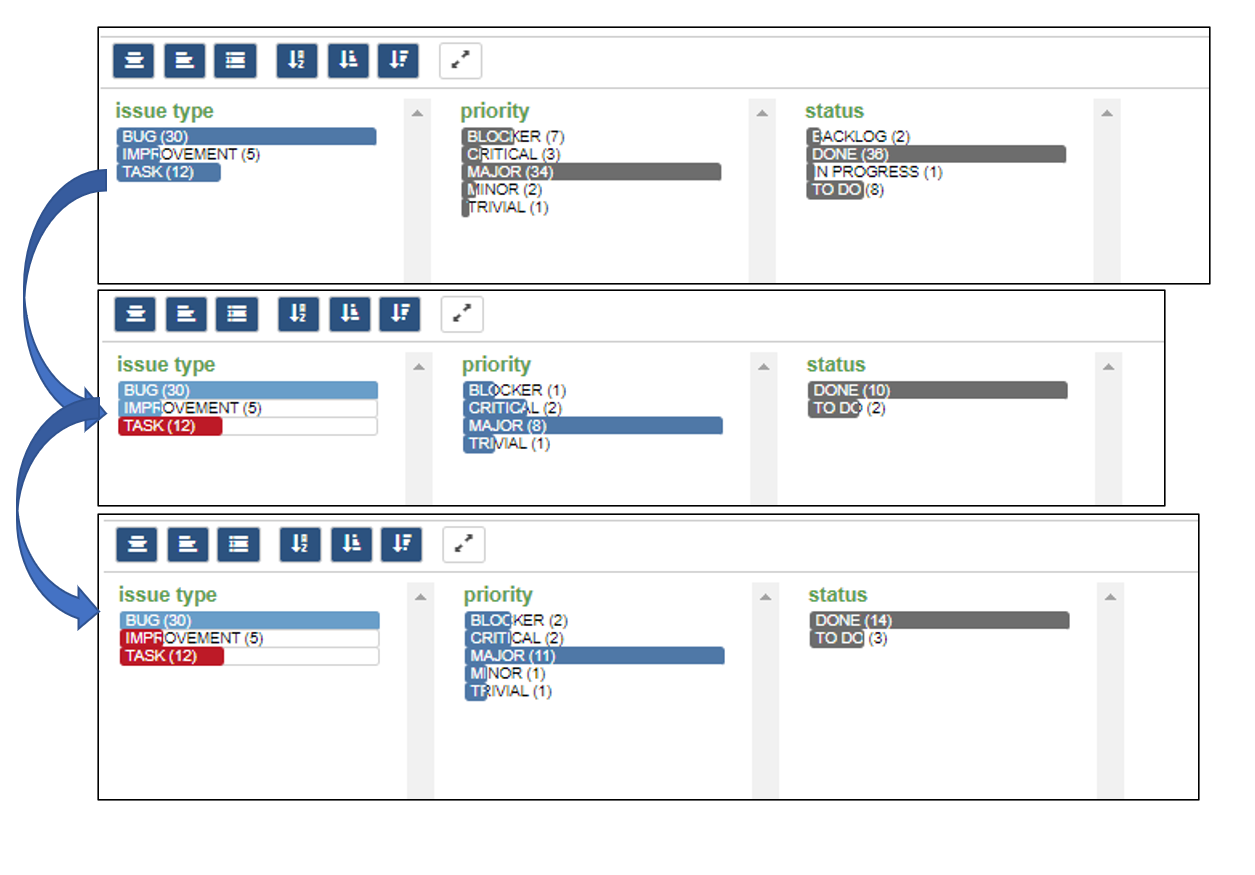
When selecting two values within one variable you add the issues with that property to the result. When choosing one property in the variable to the right (in the next variable) you filter the results.
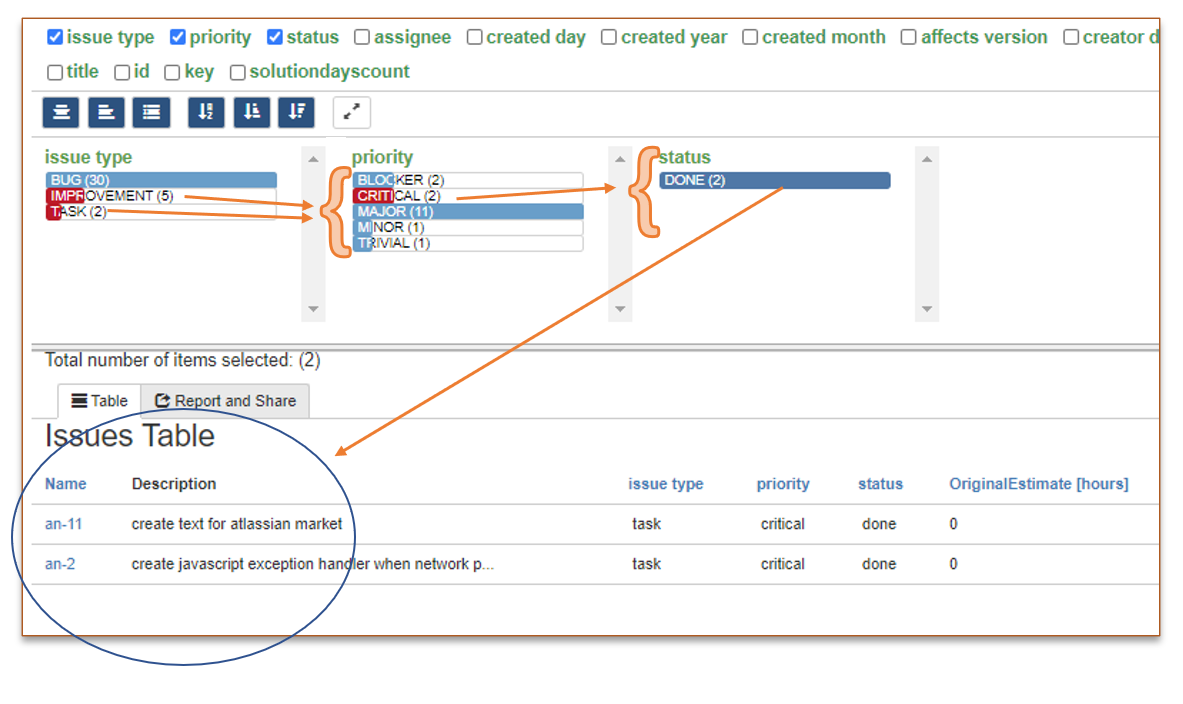
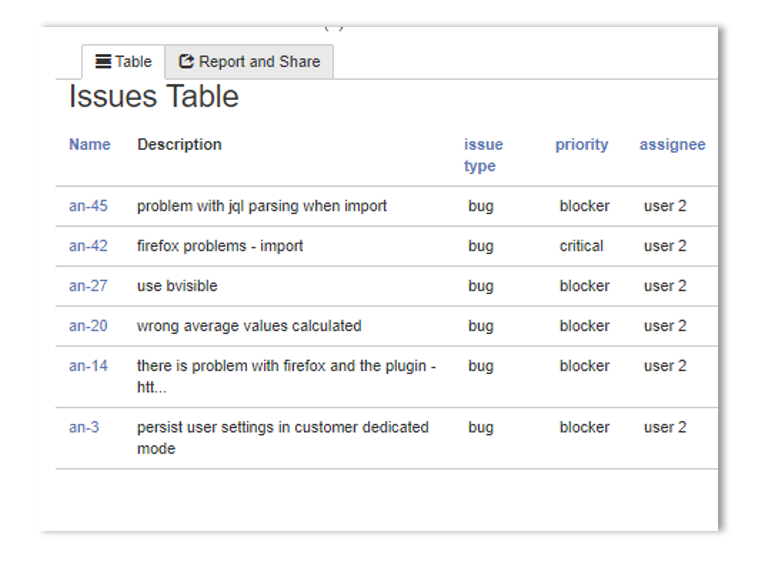
Result area
Immediately during the interactive drilldown the results of the analysis are displayed at the bottom of the page
The default view is a table showing 50 hits. If you want to view all the results, click on the link above the result area.
You may click on the issue number to navigate to the actial issue in Jira
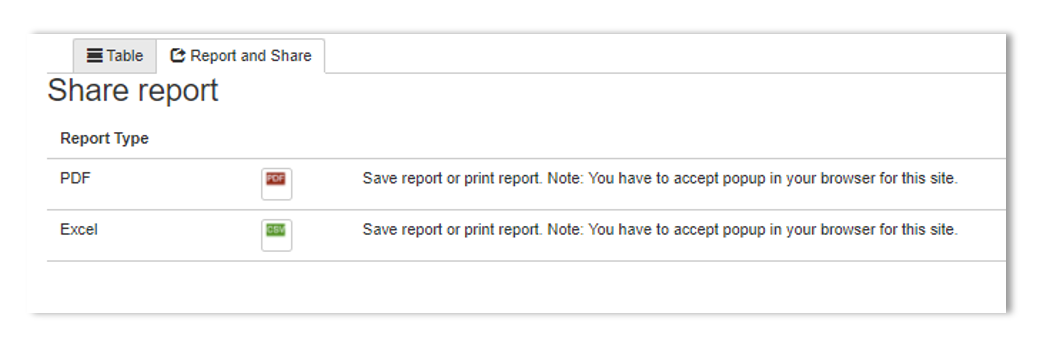
If you click on the tab with name reports you will be shown two buttons
The pdf button will generate and download a simple pdf report of the result you have drilled down to including all issues
The excel button will generate and download a simple excel report listing all issues found in your analysis
We are open to improvement on these reports, so please contact info@abacolla.com if you have any suggestions for improvement.